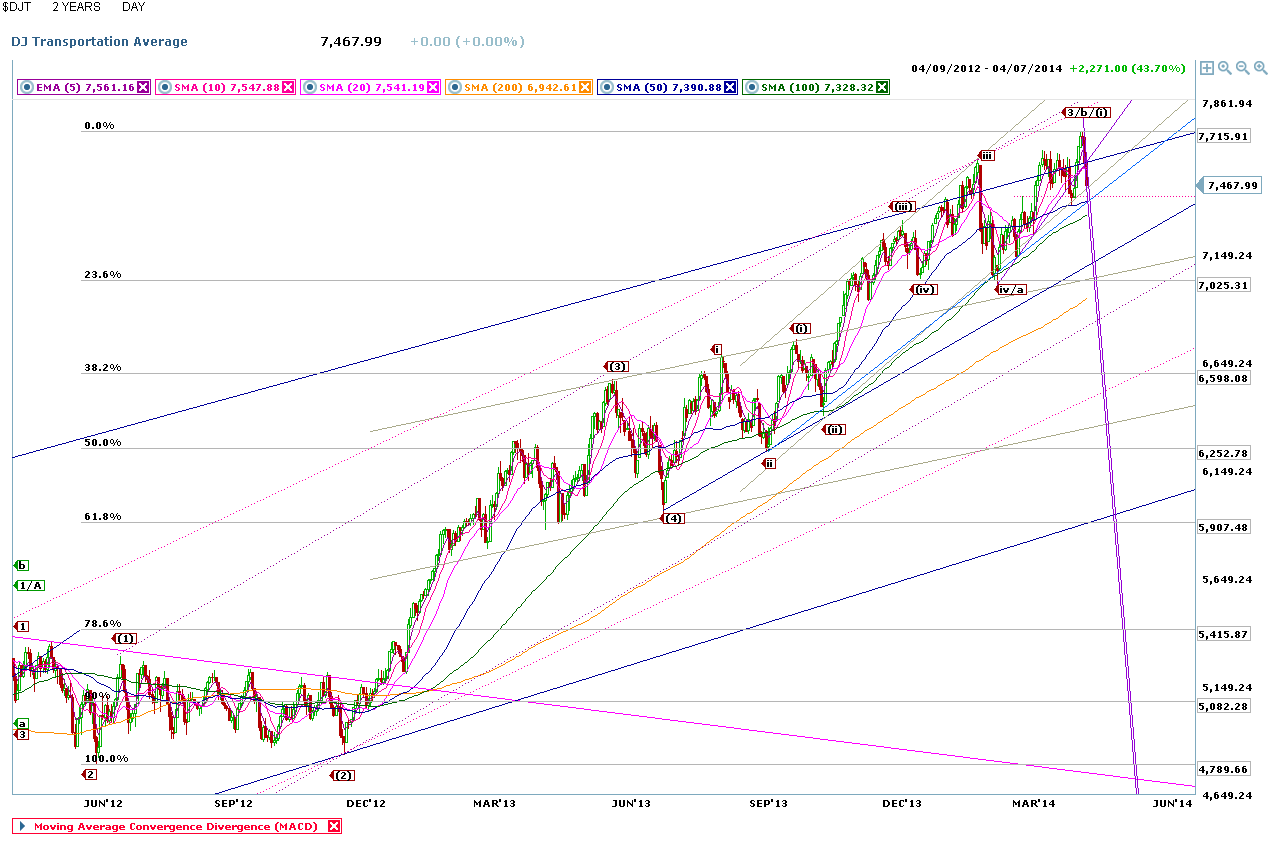
The charts are giving some warning signs that all is not well in the land of OZ where we have a green paper road instead of a yellow brick one. We all know how that bricks and sticks (makes paper right?) thing worked out for the three little pigs. Instead of droning on about stories with well known outcomes, how about we get into some charts where the outcomes are not quite as clear.
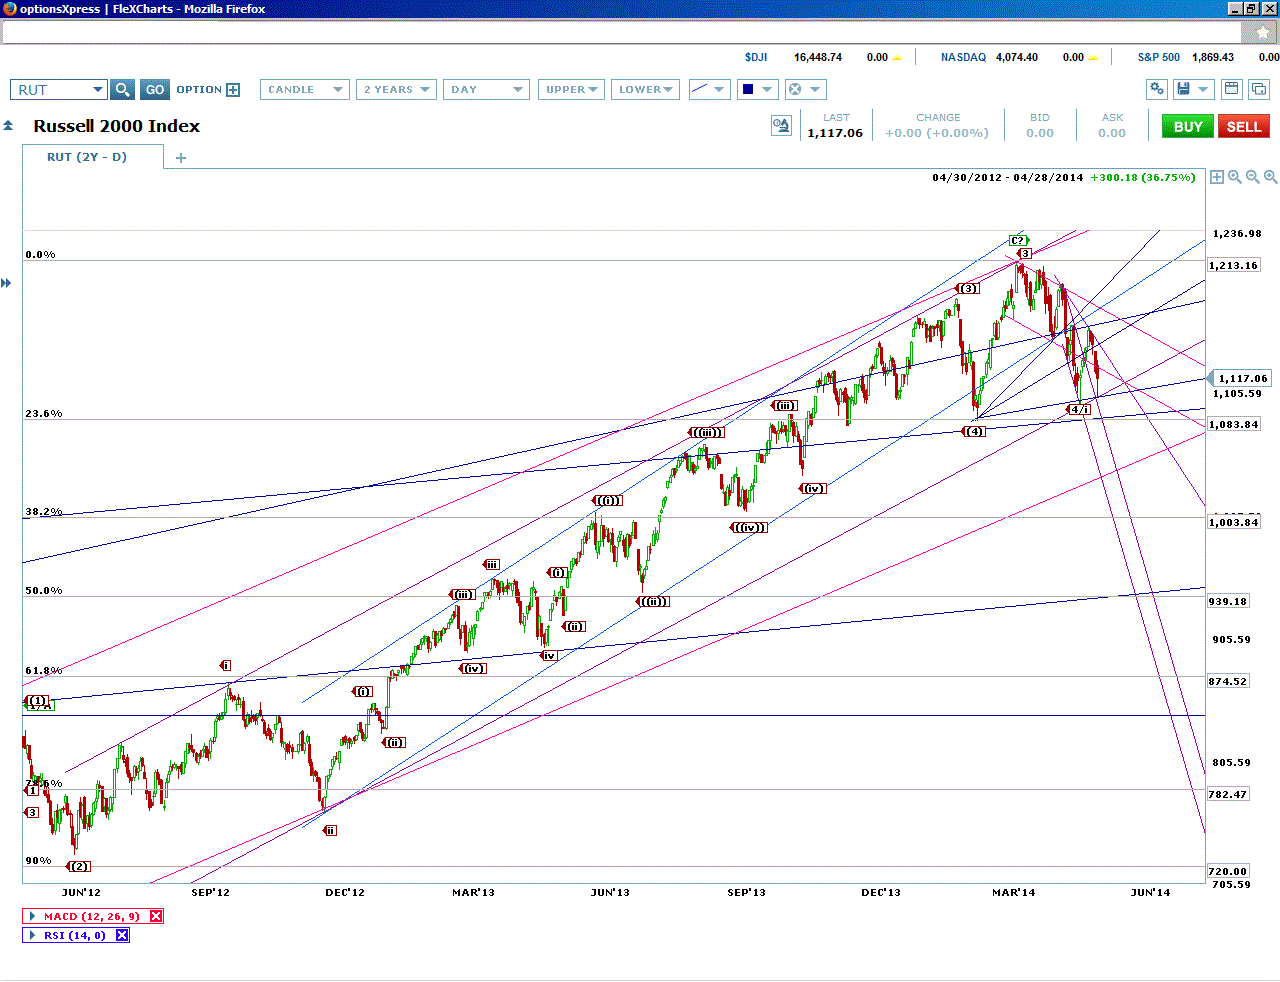
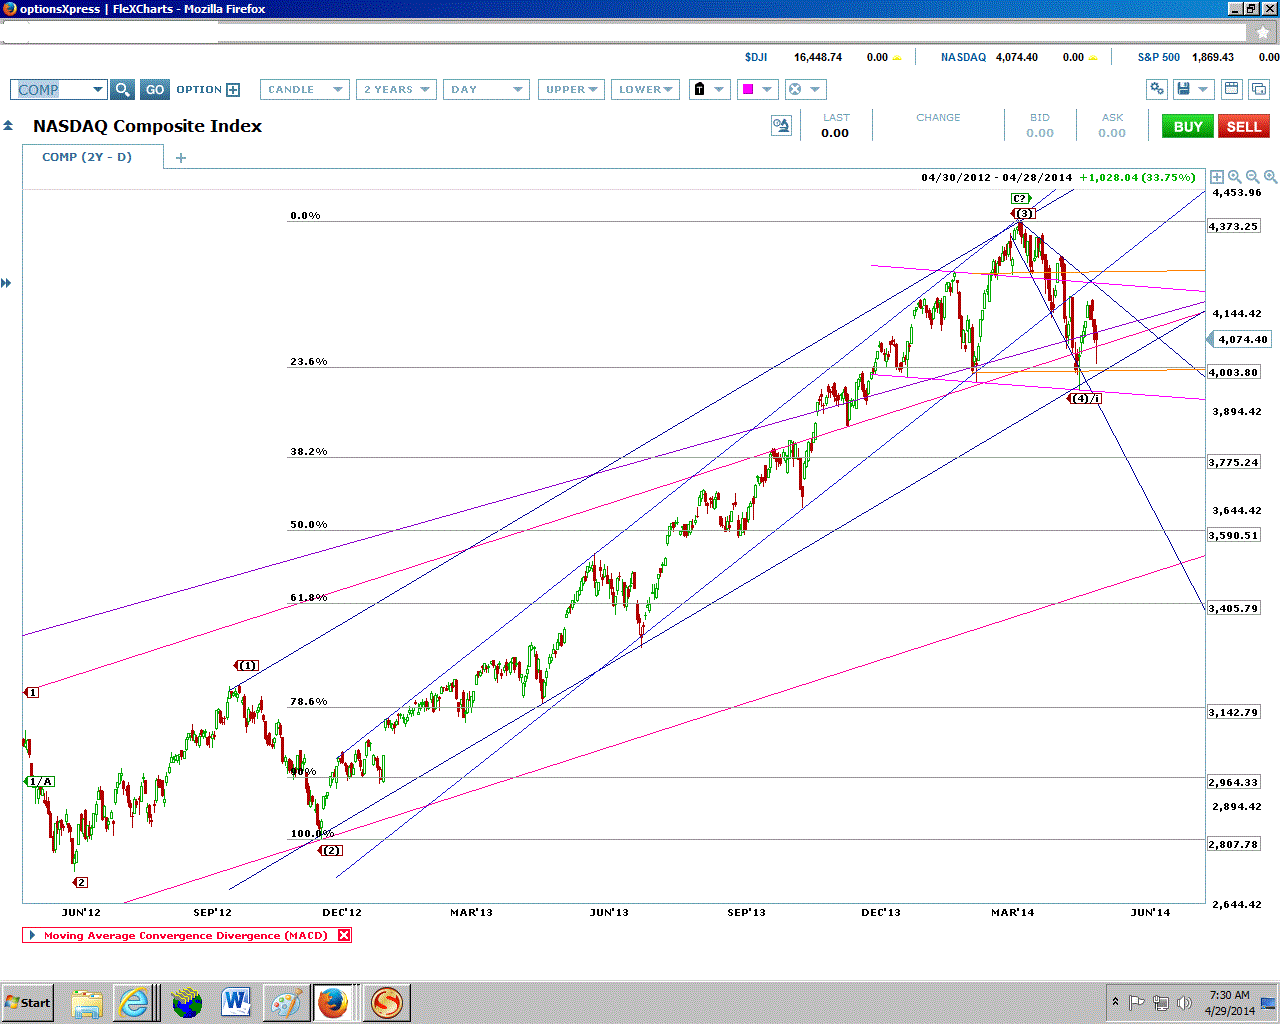
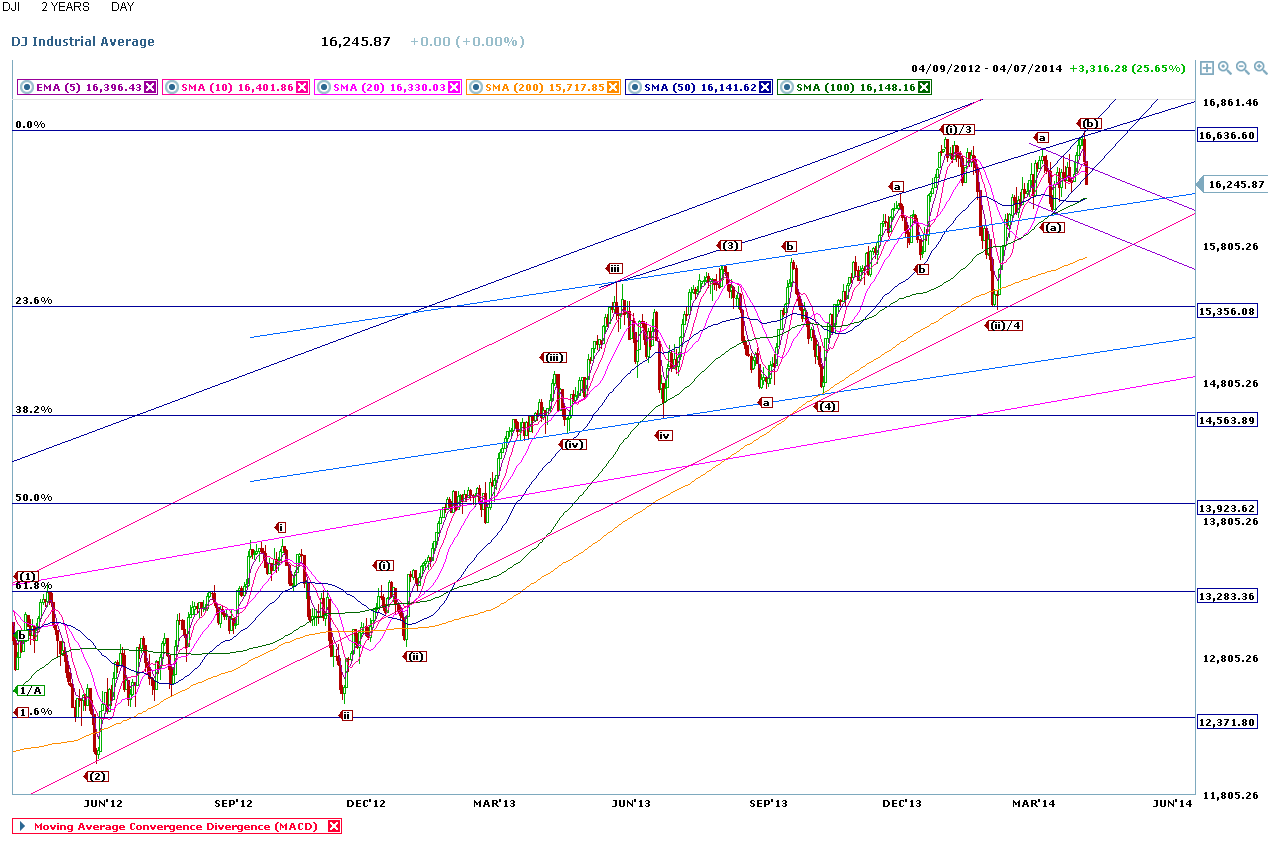
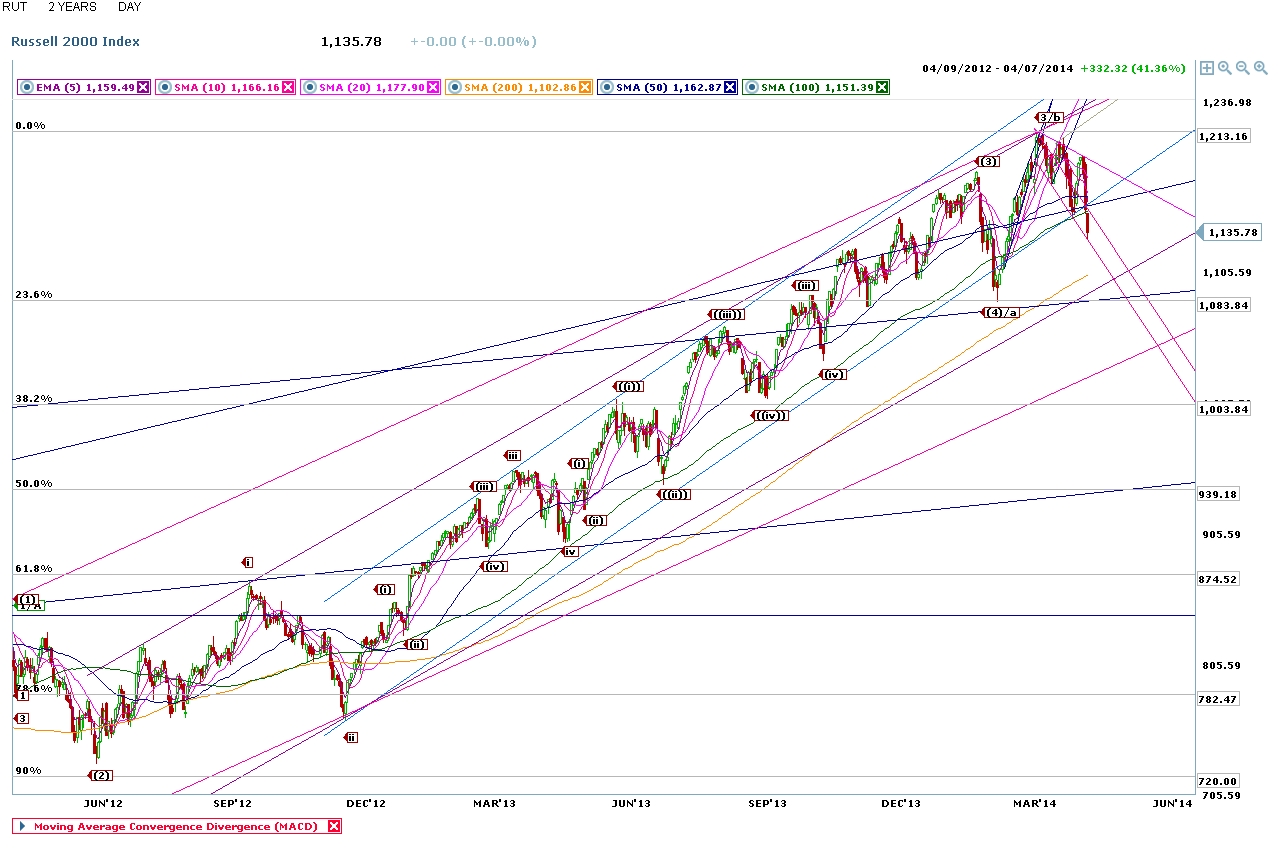
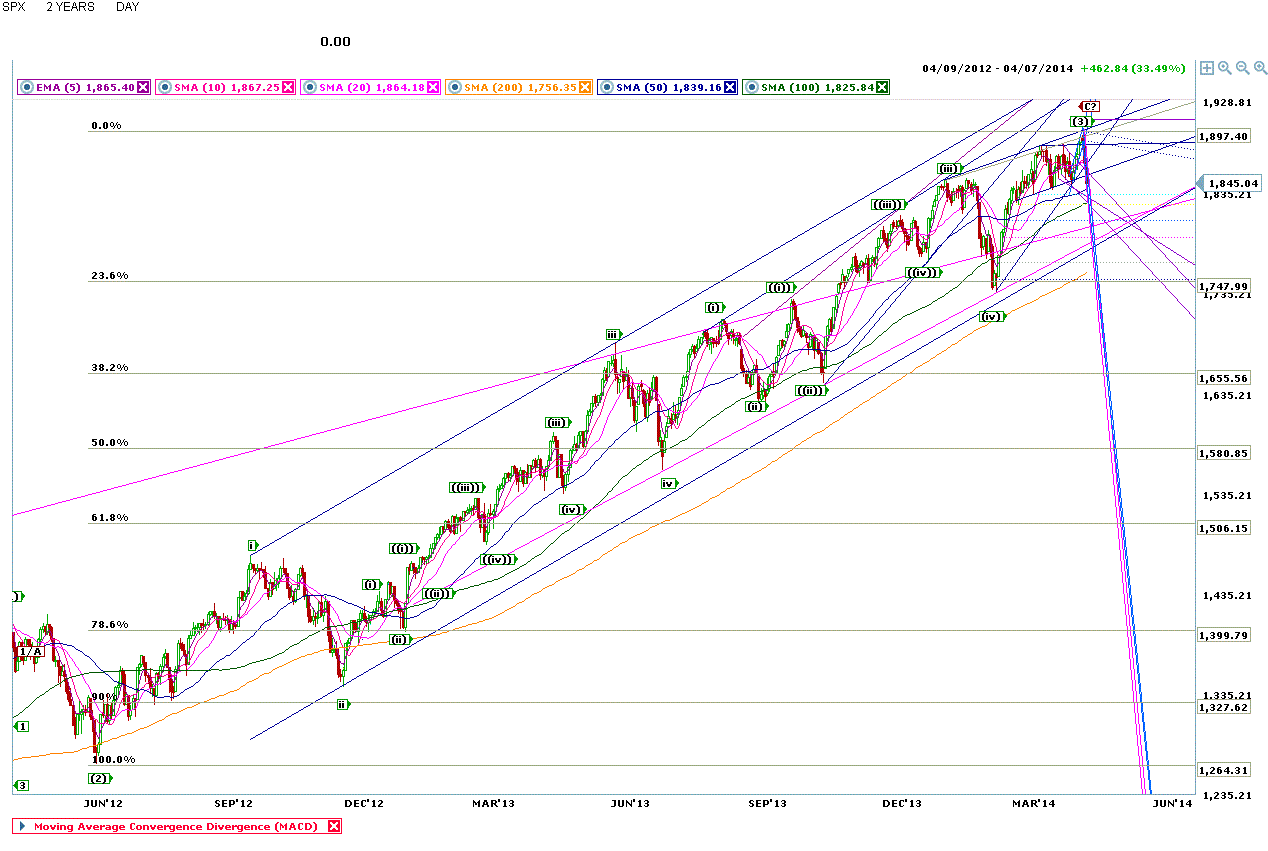
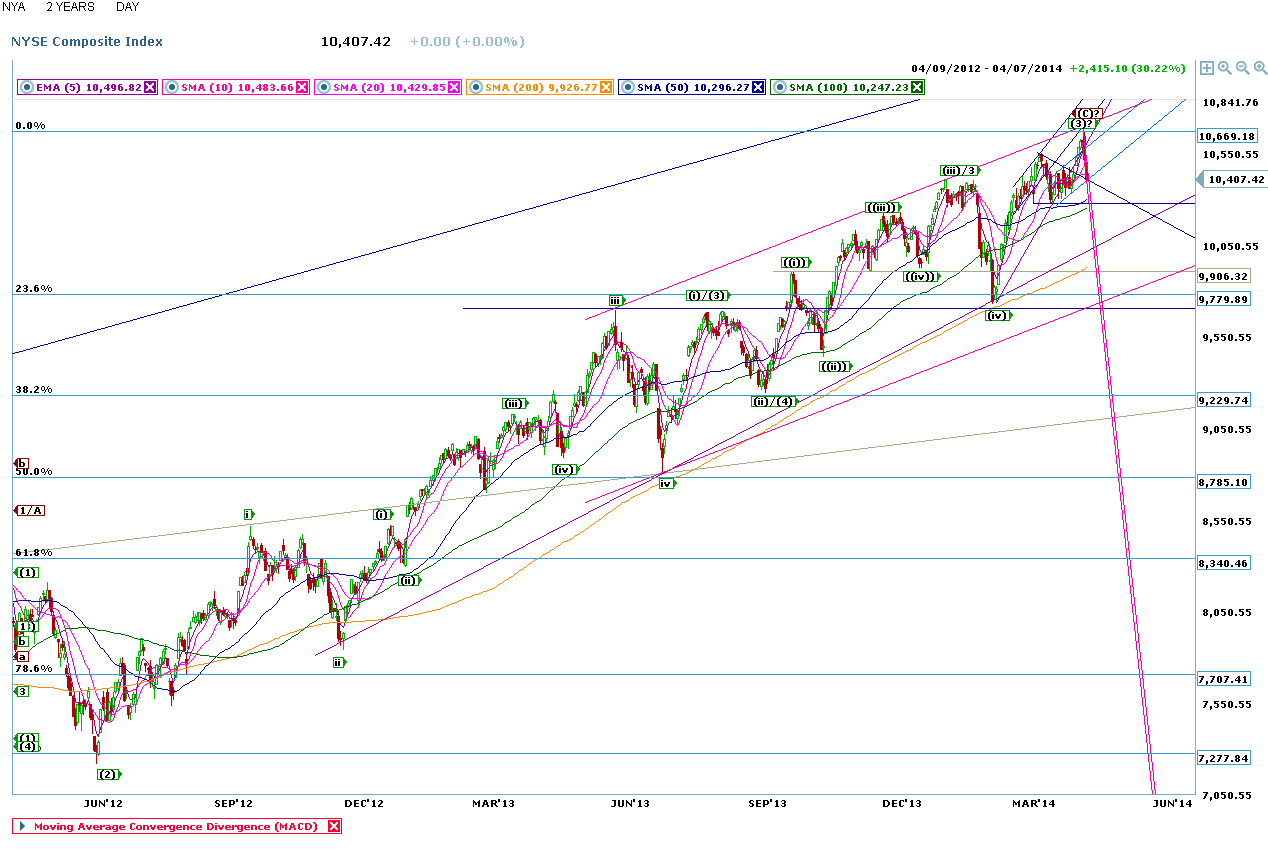
The Russell 2000 and Nasdaq Composite have both outperformed to the downside compared to the larger cap indexes such as the Dow Jones Industrial Index and the S&P 500. I’d personally like to see another high out of both the Russell and Nasdaq, but I wouldn’t be astonished if they have put in their LT tops here either.
RUSSELL 2000
NASDAQ COMPOSITE
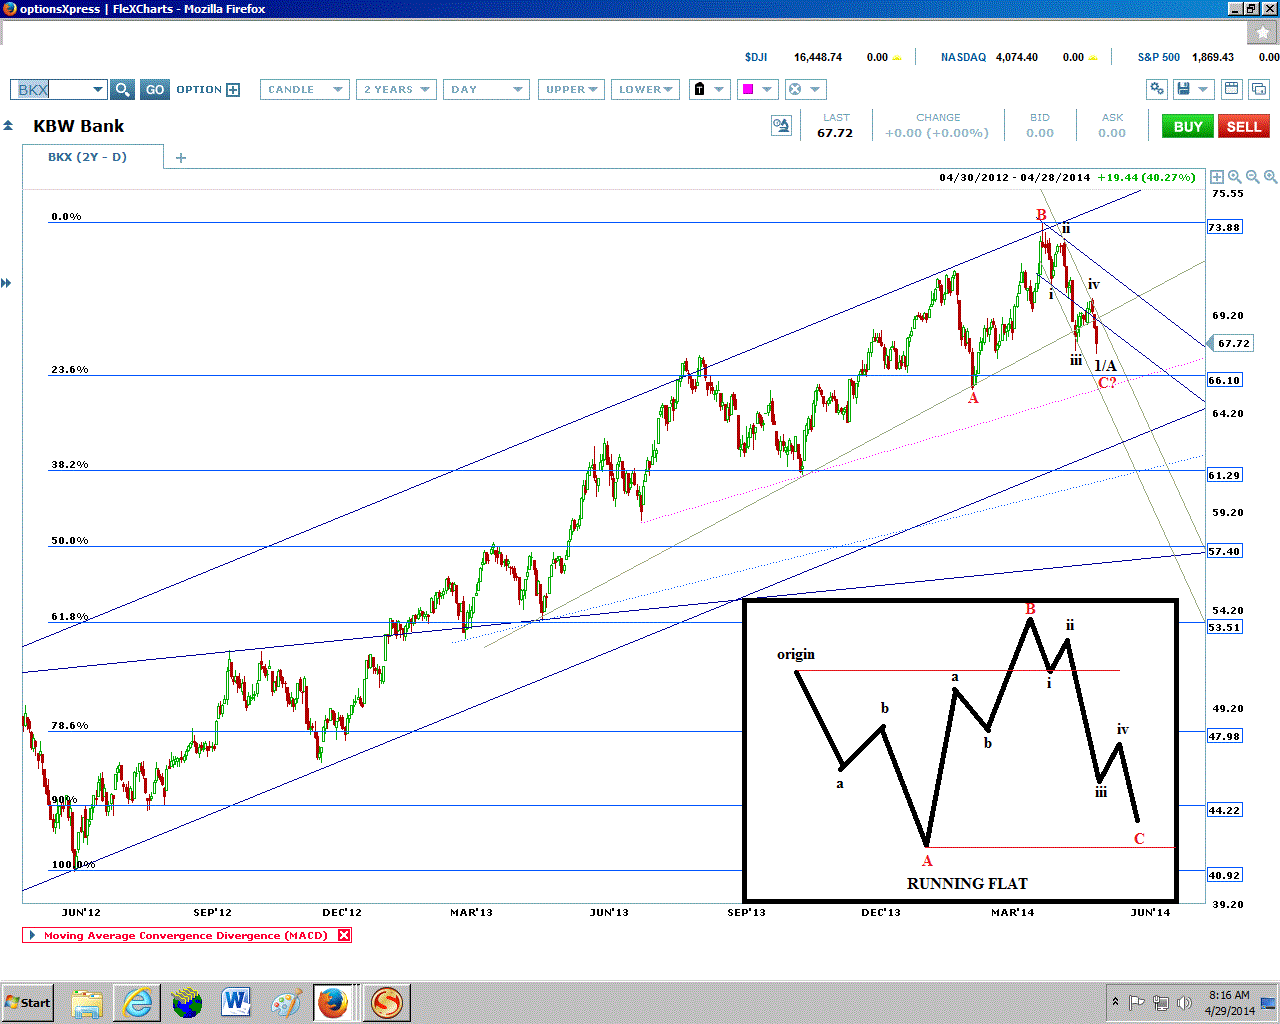
While the above two are somewhat telling, the BKX (KBW Bank Index) is the big red flag. There is a market adage ‘as go the piggies, so goes the poke’ meaning without the banks, there will be no sustainable rallies in the markets. This index is sporting a nice five down sequence at the moment. With the exception of the wave C of a flat, all other Elliott Wave sequences have paired five wave moves. So with looking at this current decline as a lone five wave sequence at present, it is relatively easy to draw a conclusion that another five wave sequence in the same direction is required to make a pair. Touching a bit more on the single five wave sequence in a flat, more importantly in this case a running flat, there are some specifics to note. Running flats are skewed in the direction of trend meaning the wave B exceeds the origin and wave C fails to exceed the start of wave B. The theory is that the strength of the coming move in the direction of trend is so powerful that it twists the corrective structure in the trends direction. Pretty scary if you’re a bear huh? On the flip side, these structures are rare, so one needs to take in other considerations before assuming a running flat as a primary count. I personally go with the simpler structures first and make more complex ones ‘prove’ themselves to me. It is all about probabilities, and using this approach keeps you out of trouble more often than not.
KBW BANK INDEX
In conclusion I’d like to see another high in pretty much every market directly with the exception of the BKX, but with the under performance of the small cap indices, market tops across the board wouldn’t be a huge surprise here either. Keep you head up and risk down. Trade well peeps.
